Russian exports now face East
By Rhod Mackenzie
Russia's foreign trade has been almost totally reoriented towards the East, mainly towards China. Moreover, in many respects Russia's trade with China has already surpassed the peak levels of trade with the EU in previous years. As the acting head of the Federal Customs Service (FCS) of the Russian Federation, Ruslan Davydov, said at a meeting of the president with members of the government, trade turnover with China increased by $35 billion (+27%) in the first nine months of 2023. If this pace continues, he predicts that by the end of the year the volume of Russian-Chinese trade could reach $215-220 billion.
There have been many other changes in Russia's foreign trade, although surprisingly some things have remained virtually unchanged.
Bird's eye view
Let's start with the general figures. Unfortunately, in today's conditions, the Federal Customs Service provides access to only a very limited set of data, and even then with a long delay. At the moment, even the most general indicators are only available until January 2023. The Bank of Russia is more generous with its statistics. Of course, data on the balance of payments do not fully correspond to indicators of exports and imports of goods, since they refer to payments for foreign trade transactions, which are not always synchronised with the deliveries of goods themselves, but are quite close to them. For example, the discrepancy between the balance of payments and the Federal Customs Service figures for exports in 2022 is only 0.1% (0.25% in 2021), while for imports it is already 6.7% (3.6% in 2021).
Thus, according to the balance of payments method, Russian exports in January-September 2023 will fall by almost a third compared to the same period last year - by 29.8% - and by 7.5% compared to 2021. It is useful to recall that 2022 was a record year for Russian energy exports, largely due to abnormally high prices for them on the world market. At the same time, imports in January-September 2023 increased by 16.1% compared to 2022 and by 3.8% compared to 2021. However, it should be noted that these indicators were affected by rising prices due to sanctions and the subsequent increase in transaction and transport costs, as well as a partial shift to parallel imports.
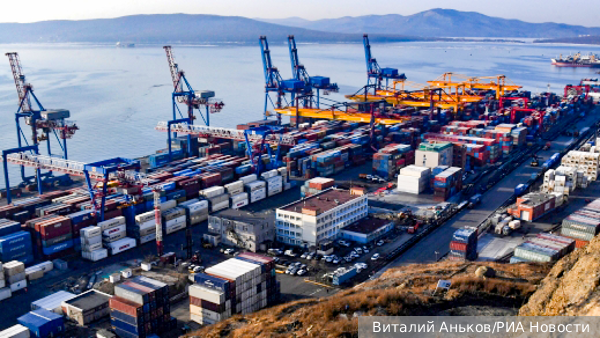
Changes in the physical volume of shipments without FCS statistics can be assessed by the volume of seaport loading and export shipments by rail. According to the Association of Commercial Sea Ports (ASOP), the volume of cargo handled by Russian seaports in the first nine months of 2023 increased by 9% compared to the same period of the previous year. There was a 7.3% increase in export cargo, a 9.2% increase in import cargo and an 11.5% increase in transit cargo.
On the other hand, according to Russian Railways' operational data, shipments in the first nine months amounted to 926.8 million tonnes, 0.6% more than in the same period last year. Unfortunately, Russian Railways does not highlight export shipments in these statistics. There is only data on the loading of export cargo in ports, which increased by 2.4% in January-September and amounted to 251.8 million tonnes. Container transport increased by 13.1% in January-September, with domestic transport accounting for just over 40%, the rest apparently being external.
As we can see, the growth in imports in monetary terms is due not only to rising prices but also to an increase in the volume of physical deliveries, but in exports there is a decline against the background of an increase in physical volumes, i.e. the fall in prices of Russian goods turned out to be even greater than the balance of payments data would suggest.
We don't trade with the Anglo-Saxons.
Of course, it is difficult to understand the country structure of Russian exports and imports without FCS statistics. Unfortunately, the Central Bank does not currently provide such details. We have to rely on the "mirror" statistics of Russia's trading partners. The European think-tank Bruegel has collected such data for 38 countries, based on their statistics and customs departments, as well as data from the EU's statistical office (Eurostat). The list includes 27 European Union countries, China, the US, South Korea, Japan, India, the UK, Turkey, Switzerland, Norway, Brazil and Kazakhstan.
The total volume of Russian exports reported by these countries for the eight months of 2023 corresponds to 83% of Russia's merchandise exports for this period, according to the balance of payments methodology. The volume of imports from these countries to Russia is equivalent to 63.6% of imports as reported by the Central Bank. By combining the data from Bruegel and the Central Bank, we can roughly estimate the share of each country in Russia's imports and exports.
Using this method, the EU's share of Russian exports in the first eight months of 2021 fell from 38.9% in 2021 to 14.2% in 2023, the US share from 6.8% to 1.2%, and the UK share from 3.3% to almost zero. On the other hand, China's share rises from 16.1 to 29.9%, India's from 1.6 to 15.2% and Turkey's from 6 to 11.5%.
As Andrey Gnidchenko, a leading expert in the analysis and forecasting of the development of industries in the real sector of the TsMAKP, explains, the structure of export supplies changed slowly, as the export of goods to the EU was not immediately blocked by sanctions (restrictions from the spring of 2022 applied mainly to the import of goods to Russia; more or less significant export sanctions were, on the whole, introduced only towards the end of 2022). Andrey Gnidchenko estimates the share of imports from the EU via intermediary countries (mainly the CIS) at around 5% (according to Eurostat data on additional growth of EU exports to the CIS after 2022).
Although the changes in the structure of imports have been much faster, the overall picture is roughly the same. The EU share of Russian imports in the first eight months of the year fell from 35.8% in 2021 to 14.2% in 2023, the US share from 2.2% to just 0.2% and the UK share from 1.3% to 0.4%. Imports from China increase from 21.1% to 35.7% and from Turkey from 1.8% to 3.7%. At the same time, imports from India only increased from 1.1% to 1.3%. Hence the problems in trade with this country in national currencies. Russia is selling more and more to India, but the growth of the reverse flow of goods is very slow. By the way, imports from Turkey have almost doubled compared to 2021, which is also partly reflected.
Alexander Daniltsev, the Director of the Institute of Trade Policy at the National Research University Higher School of Economics, makes roughly the same assessment. According to him, in 2022 compared to 2021, exports to Japan will fall by 12%, to the United States by 58%, and imports by 50% and 40%, respectively. In the first quarter of 2023, Russian exports to Japan will fall by 49% compared to the first quarter of 2022, and to the EU and the US by 74-75%. At the same time, exports to China increased by 25%, to Brazil by 12% and to Turkey by 3%.
Speaking at a meeting of the President with members of the Government, Ruslan Davydov said that the five busiest border crossings on the Russian-Chinese and Russian-Azerbaijani borders had been transferred to 24-hour operation in agreement with partners. Throughput capacity at priority sections of the border has almost doubled, and the problem of queues at the busiest checkpoints in the North Caucasus and the Far East has been virtually solved.
In addition, according to the Acting Head of the Federal Customs Service, this year foreign trade turnover in the Far East has increased by 14.2% in total, and by 2.4 times in road transport. We have already mentioned the particularly active growth of trade turnover with China.
What do we take where?
Neutral and friendly countries are making considerable efforts at government level to switch trade with our country to national currencies. Companies and banks in these countries are in no hurry, but the process is underway. For example, according to the Bank of Russia's statistics, by August 2023, 38.8% of payments for Russian exports had already been made in rubles and 35.8% in currencies that are not on the list of unfriendly currencies. However, the Central Bank is still showing some cunning: judging by the fact that the share of payments in rubles for the European region is 53.1%, it can be assumed that this also includes a gas trade scheme "for rubles", where the currency exchange for payment takes place after it arrives in Russia. The share of rouble payments for imports up to August 2023 reached 30.1%, the share of "neutral" and "friendly" currencies - 40.9%. Unfortunately, it is not clear from the statistics how much this indicator is influenced by trade with post-Soviet countries.
Next, it would be correct to consider changes in the commodity structure of exports and imports, but this data is the most difficult to obtain. In the Russian statistics they are completely closed, but in the "mirror" statistics they usually come with a long delay. However, general trends can be deduced from the data on loading provided by seaports and Russian Railways.
The volume of coal transshipment in sea ports in January-September 2023 increased by 7.4%, containerized cargo - by 9.3%, the volume of food cargo transshipment - by 33.8%, crude oil - by 6.1%, mineral fertilizers - by 1.6 times, grain - by 1.9 times (!).
And here is the list of goods with negative dynamics of transshipment: the volume of ferrous metals transshipment decreased by 16.4%, ores - by 26.9%, petroleum products - by 8%, and LNG also decreased by 4.6%. There is nothing unexpected here: food shortages are growing in the world, Europe has abandoned Russian gas and oil, but other buyers have been found for oil, and Europe itself is already officially buying "non-Russian" oil products through various schemes, and with liquefied gas the processes are not yet fully established.
Statistics on the loading of export cargoes at ports of the Russian Railways network show similar trends. In January-September the transport of grain to ports increased by 2.4 times, chemicals and soda by 1.7 times, fertilisers by 6.9%, and coal by 2.1%.
Looking at the directions of transport, the transport of coal (+12.8%), fertilisers (+10.4%), chemicals (+24.6%) and cereals (5.7 times) increased in the direction of the North-West ports. In the direction of the Far East, the transport of coal (+1.8%), oil products (+4.5%), chemicals and soda (6.1 times) and cereals (15 times) increased. To the South, the transport of oil products (+1.1%), cereals (2.3 times), ferrous metals (+2.3%) and chemicals (+34.5%) increased.
Looking at the directions of transport, the transport of coal (+12.8%), fertilisers (+10.4%), chemicals (+24.6%) and cereals (5.7 times) increased towards the ports of the north-west. In the direction of the Far East, the transport of coal (+1.8%), oil products (+4.5%), chemicals and soda (6.1 times) and cereals (15 times) increased. To the south, the transport of oil products (+1.1%), cereals (2.3 times), ferrous metals (+2.3%) and chemicals (+34.5%) increased.
An example of a fast-growing area is the supply of coke from Russia to India, which, according to the Indian Ministry of Commerce and Industry, increased 2.3 times year-on-year to 4.3 million tonnes in the eight months of 2023. As a result, Russia's share of India's coking coal imports rose from 5 to 11.2%.
Interestingly, India is also increasing its purchases of another carbon-containing Russian commodity - diamonds. A record was set in August when India bought them for $215.1 million. The previous comparable diamond purchase was in March 2018 ($481 million). Since the beginning of the year, India's purchases of Russian diamonds have increased by 29% compared to the same period in 2022.
Unfortunately, there is no separate data on export shipments directly by rail. However, the General Director and Chairman of the Board of Directors of Russian Railways, Oleg Belozerov, told the International Coordination Council for Trans-Eurasian Transportation (ICSTC) that in the first nine months of 2023, shipments to China amounted to more than 128 million tonnes, which is almost 52% more than in the same period last year.
The situation remains uncertain
The Bank of Russia keeps statistics on payments in the currencies of friendly and unfriendly countries for foreign trade transactions. What are the general trade statistics with these groups of countries? According to Alexander Knobel, Director of the International Trade Research Centre at RANEPA and Head of the International Trade Laboratory at the Gaidar Institute, in the spring of 2002 there was a simultaneous sharp decline in imports from both "unfriendly" and neutral countries. According to him, the reason for this was, firstly, that the ruble exchange rate had entered a phase of extremely high volatility - this increased the risks of conducting cross-border trade with Russia, and the availability of cross-border payments was limited by the disconnection of a number of Russian banks from the SWIFT system. Second, a significant part of the supply of goods from the EU passed through the territory of Ukraine. Thirdly, trade with neutral countries by sea has become difficult due to restrictions on the entry of ships with cargo for Russia into the ports of EU member states and/or their shipment to European ports.
From May 2022, the dynamics of the supply of goods by the two groups of countries diverge: exports of neutral countries to Russia recovered dynamically in May 2022-January 2023, after which they stabilised at a level above the pre-crisis level (January 2022) and significantly above the average supply of these countries for 2012-2021. Exports from unfriendly countries to Russia, after a sharp decline in February-April 2022, recovered only slightly in the following months, remaining at levels two to three times lower than the pre-crisis level and well below the volumes characteristic of the 2012-2021 trade.
Although the west-to-east rebalancing is gaining momentum, the commodity structure of our foreign trade is changing slightly: what some countries lose, others gain. Moreover, the new buyers often quite honestly use Russian energy resources themselves, and in countries that have signed anti-Russian sanctions, they sell hydrocarbons from other sources that they previously purchased for themselves.
As Andrey Gnidchenko explains, the data of recent months allow us to speak with confidence about the stabilisation of imports in 2023 at a level roughly equivalent to that of 2021. This is particularly important given the sharp contraction in the external balance this year, both as a result of the recovery in imports and, to a much greater extent, as a result of the collapse in exports against the backdrop of a return to relatively normal commodity prices. "There were fears that the combination of a possible "super-growth" of imports and a fall in exports would have an extremely negative impact on the trade balance, but in September export revenues began to grow again and we seem to have successfully passed the point of maximum stress (which, by the way, also coincided with the weakening of the ruble, which could play the role of a stabiliser)," Gnidchenko adds.
Alexander Knobel also believes that the phase of reorientation towards suppliers from neutral countries is largely over, the product-country structure has stabilised, and price dynamics have normalised - the level of surcharges for deliveries to Russia is decreasing. In his opinion, the dependence of the volume of imported goods on the rouble exchange rate has reappeared in recent months, which could act as a deterrent to Russian imports in the short and medium term.
However, the main import risk, according to Knobel, is the application of a secondary sanctions regime by unfriendly countries against neutral suppliers. "For most neutral partners, especially China, the Russian market remains secondary compared to the markets of developed countries, which may lead to a refusal to supply Russia due to the risk of secondary sanctions," warns the Director of the International Trade Research Centre at RANEPA. In addition, he points out that there are still problems with payments for supplies to countries with inconvertible currencies.
"In general, the restructuring of the geographical structure of Russia's foreign trade in response to the sanctions imposed has been completed," concludes Andrei Gnidchenko. - The rhetoric of unfriendly countries suggests that no large-scale new sanctions are to be expected, and the focus of sanctions policy is shifting to monitoring compliance with the imposed restrictions. Therefore, under an unfavourable combination of circumstances (effective pressure from unfriendly countries on friendly ones), it is possible to accelerate the decline in purchases through intermediary countries, as well as to limit the access of a number of goods (in particular, diamonds and gold) to the markets of friendly countries".